Lecture note
Oxygen transport, the haemoglobin-O₂ curve, and the oxygen cascade
Exam Target
Purpose. This module teaches oxygen transport as a pathway rather than as isolated saturation numbers. In EDAIC-style questions, first decide whether the limiting step is inspired oxygen, alveolar ventilation, diffusion, haemoglobin content, haemoglobin affinity, cardiac output, extraction, or mitochondrial use.
Core idea. SpO₂ is a saturation signal, not a delivery signal. Tissue oxygenation depends on CaO₂, DO₂, extraction, and cellular utilisation.
Revision rule. When a stem gives SpO₂, PaO₂, haemoglobin, cardiac output, lactate, venous saturation, or dys-haemoglobin, identify which oxygen variable has failed before choosing the treatment.
Quick check: oxygen transport frame
What is the first question when oxygen numbers look abnormal?
Reveal answer
Identify the failed step in the oxygen pathway: inspired oxygen, alveolar ventilation, diffusion, haemoglobin content, haemoglobin affinity, cardiac output, extraction, or mitochondrial use.
Why is SpO2 not the same as oxygen delivery?
Reveal answer
SpO2 tells you haemoglobin saturation. It does not tell you haemoglobin concentration, cardiac output, tissue extraction, or whether mitochondria can use oxygen.
Which oxygen measurements can be normal despite severe tissue hypoxia?
Reveal answer
PaO2 and SpO2 may be normal in severe anaemia, carbon monoxide poisoning, low-output shock, sepsis with extraction failure, or cyanide poisoning, depending on the mechanism.
Core Concepts and Terminology
Oxygenation is not the same as ventilation
In EDAIC stems, oxygenation and ventilation often separate. Oxygenation describes oxygen transfer into arterial blood; ventilation describes carbon dioxide elimination. Treat the number that is actually abnormal instead of reflexively increasing oxygen.
How to use this table: separate oxygenation, ventilation, content, delivery, and consumption before choosing treatment.
| Term | Meaning | Main bedside marker |
|---|---|---|
| Oxygenation | Movement of oxygen from alveoli into blood | PaO₂, SaO₂, SpO₂ |
| Ventilation | Removal of carbon dioxide from blood into alveoli | PaCO₂, EtCO₂ |
| Oxygen content | Amount of oxygen carried in blood | CaO₂ |
| Oxygen delivery | Oxygen delivered to tissues per minute | DO₂ |
| Oxygen consumption | Oxygen used by tissues per minute | VO₂ |
A sedated patient with opioid-induced hypoventilation may have both high PaCO₂ and low PaO₂. Giving oxygen may improve SpO₂, but if ventilation remains inadequate, CO₂ will continue to rise. Conversely, a shocked patient may have normal PaO₂ and SpO₂ but poor tissue oxygen delivery because cardiac output is low.
Hypoxaemia versus hypoxia
Hypoxaemia means low arterial oxygen tension, PaO₂.
Hypoxia means inadequate oxygen availability at tissue level.
A patient can have hypoxia without hypoxaemia.
Examples:
| Situation | PaO₂ | Tissue oxygenation problem |
|---|---|---|
| Severe anaemia | Normal | Low oxygen content |
| Low cardiac output shock | Normal or low | Low oxygen delivery |
| Carbon monoxide poisoning | Often normal | Hb binding sites occupied by CO |
| Cyanide poisoning | Normal | Mitochondria cannot use oxygen |
| Sepsis | Often variable | Maldistribution and impaired extraction/use |
Exam message:
PaO₂ tells you about dissolved oxygen tension, not total oxygen content or tissue oxygen delivery.
Types of tissue hypoxia
Use this classification to avoid the common exam error of treating every oxygen problem with FiO2 alone.
| Type | Mechanism | Example |
|---|---|---|
| Hypoxaemic hypoxia | Low PaO₂ | Pneumonia, hypoventilation, altitude |
| Anaemic hypoxia | Low haemoglobin or dysfunctional Hb | Anaemia, CO poisoning, methaemoglobinaemia |
| Stagnant/circulatory hypoxia | Low blood flow | Shock, cardiac arrest, regional ischaemia |
| Histotoxic hypoxia | Cells cannot use oxygen | Cyanide poisoning, severe mitochondrial dysfunction |
| Dyshaemoglobinaemic hypoxia | Abnormal Hb species | COHb, MetHb |
This classification reminds students that oxygen therapy alone does not fix every oxygen problem.
Quick check: oxygenation, ventilation and hypoxia
How do oxygenation and ventilation differ?
Reveal answer
Oxygenation is oxygen transfer into blood and is reflected by PaO2, SaO2, or SpO2. Ventilation is carbon dioxide removal and is reflected by PaCO2 or EtCO2.
How do hypoxaemia and hypoxia differ?
Reveal answer
Hypoxaemia is low arterial oxygen tension. Hypoxia is inadequate oxygen availability or use at tissue level and can occur without low PaO2.
What are the main tissue hypoxia patterns?
Reveal answer
Hypoxaemic, anaemic, stagnant or circulatory, histotoxic, and dys-haemoglobin-related hypoxia. The treatment depends on which pattern is limiting oxygen use.
Oxygen Carriage in Blood
Two forms of oxygen transport
Oxygen is carried in blood in two forms:
- Bound to haemoglobin — the dominant form.
- Dissolved in plasma — small but physiologically important because PaO₂ is the dissolved oxygen tension.
Approximate normal values:
| Form | Approximate amount |
|---|---|
| Bound to haemoglobin | ~19–20 mL O₂/dL blood |
| Dissolved in plasma | ~0.3 mL O₂/dL blood |
| Total arterial oxygen content | ~20 mL O₂/dL blood |
So more than 98% of oxygen content is carried bound to haemoglobin under normal conditions.
Why dissolved oxygen still matters
Although dissolved oxygen contributes little to total oxygen content, it determines PaO₂.
PaO₂ is important because it:
- drives diffusion from alveoli to blood,
- determines haemoglobin saturation according to the HbO₂ curve,
- contributes to chemoreceptor stimulation when very low,
- is measured on arterial blood gas analysis,
- defines hypoxaemia.
But PaO₂ alone can mislead. In severe anaemia, PaO₂ may be normal because the oxygen dissolved in plasma is normal, but oxygen content is low because there is little haemoglobin to carry oxygen.
Arterial oxygen content equation
The arterial oxygen content, CaO₂, is calculated as:
CaO₂ = oxygen bound to Hb + oxygen dissolved in plasma
Using conventional units:
CaO₂ = (1.34 × Hb × SaO₂) + (0.003 × PaO₂)
where:
- CaO₂ = mL O₂/dL blood,
- Hb = g/dL,
- SaO₂ = fractional saturation, not percentage,
- PaO₂ = mmHg,
- 1.34 = mL O₂ carried per gram of fully saturated Hb,
- 0.003 = mL O₂ dissolved per dL blood per mmHg.
In SI-friendly form:
CaO₂ = (1.34 × Hb × SaO₂) + (0.023 × PaO₂ in kPa)
because 1 kPa is about 7.5 mmHg.
Normal CaO₂ calculation
Assume:
- Hb = 15 g/dL,
- SaO₂ = 0.98,
- PaO₂ = 13 kPa.
Bound oxygen:
1.34 × 15 × 0.98 = 19.7 mL/dL
Dissolved oxygen:
0.023 × 13 = 0.3 mL/dL
Total:
CaO₂ ≈ 20 mL/dL
This is the key exam number.
Why anaemia can be dangerous with normal SpO₂
Example:
Patient A:
- Hb 15 g/dL,
- SaO₂ 100%,
- CaO₂ ≈ 20 mL/dL.
Patient B:
- Hb 7.5 g/dL,
- SaO₂ 100%,
- CaO₂ ≈ 10 mL/dL.
Both patients can have SpO₂ 100%, but patient B carries about half as much oxygen per dL of blood.
This is one of the most important practical lessons in oxygen physiology:
Saturation tells you how full the haemoglobin is; it does not tell you how much haemoglobin is present.
Does increasing FiO₂ greatly increase oxygen content?
Once haemoglobin is nearly fully saturated, increasing FiO₂ produces only a small increase in oxygen content because it mainly increases dissolved oxygen.
At normal atmospheric pressure, even a large rise in PaO₂ adds relatively little dissolved oxygen compared with haemoglobin-bound oxygen.
Example:
If PaO₂ rises from 13 kPa to 60 kPa:
- dissolved oxygen rises from about 0.3 to about 1.4 mL/dL,
- but bound oxygen changes very little if Hb was already saturated.
This explains why treating severe anaemia requires haemoglobin or increased cardiac output, not simply more inspired oxygen, although oxygen may still be helpful as a temporary measure.
Hyperbaric oxygen is different because high pressure can greatly increase dissolved oxygen content.
Quick check: oxygen content
What are the two terms in arterial oxygen content?
Reveal answer
CaO2 is haemoglobin-bound oxygen plus dissolved oxygen: (1.34 x Hb x SaO2) + dissolved oxygen. The haemoglobin-bound term dominates at normal pressure.
Why can severe anaemia have normal SpO2 and PaO2?
Reveal answer
The haemoglobin present may be fully saturated and dissolved oxygen tension may be normal, but the total amount of haemoglobin available to carry oxygen is too low.
Why does high FiO2 add little oxygen content once haemoglobin is saturated?
Reveal answer
At normal pressure, the dissolved oxygen term is small. More FiO2 raises PaO2, but most content is still limited by Hb concentration and saturation.
Haemoglobin Structure and Function
Haemoglobin structure
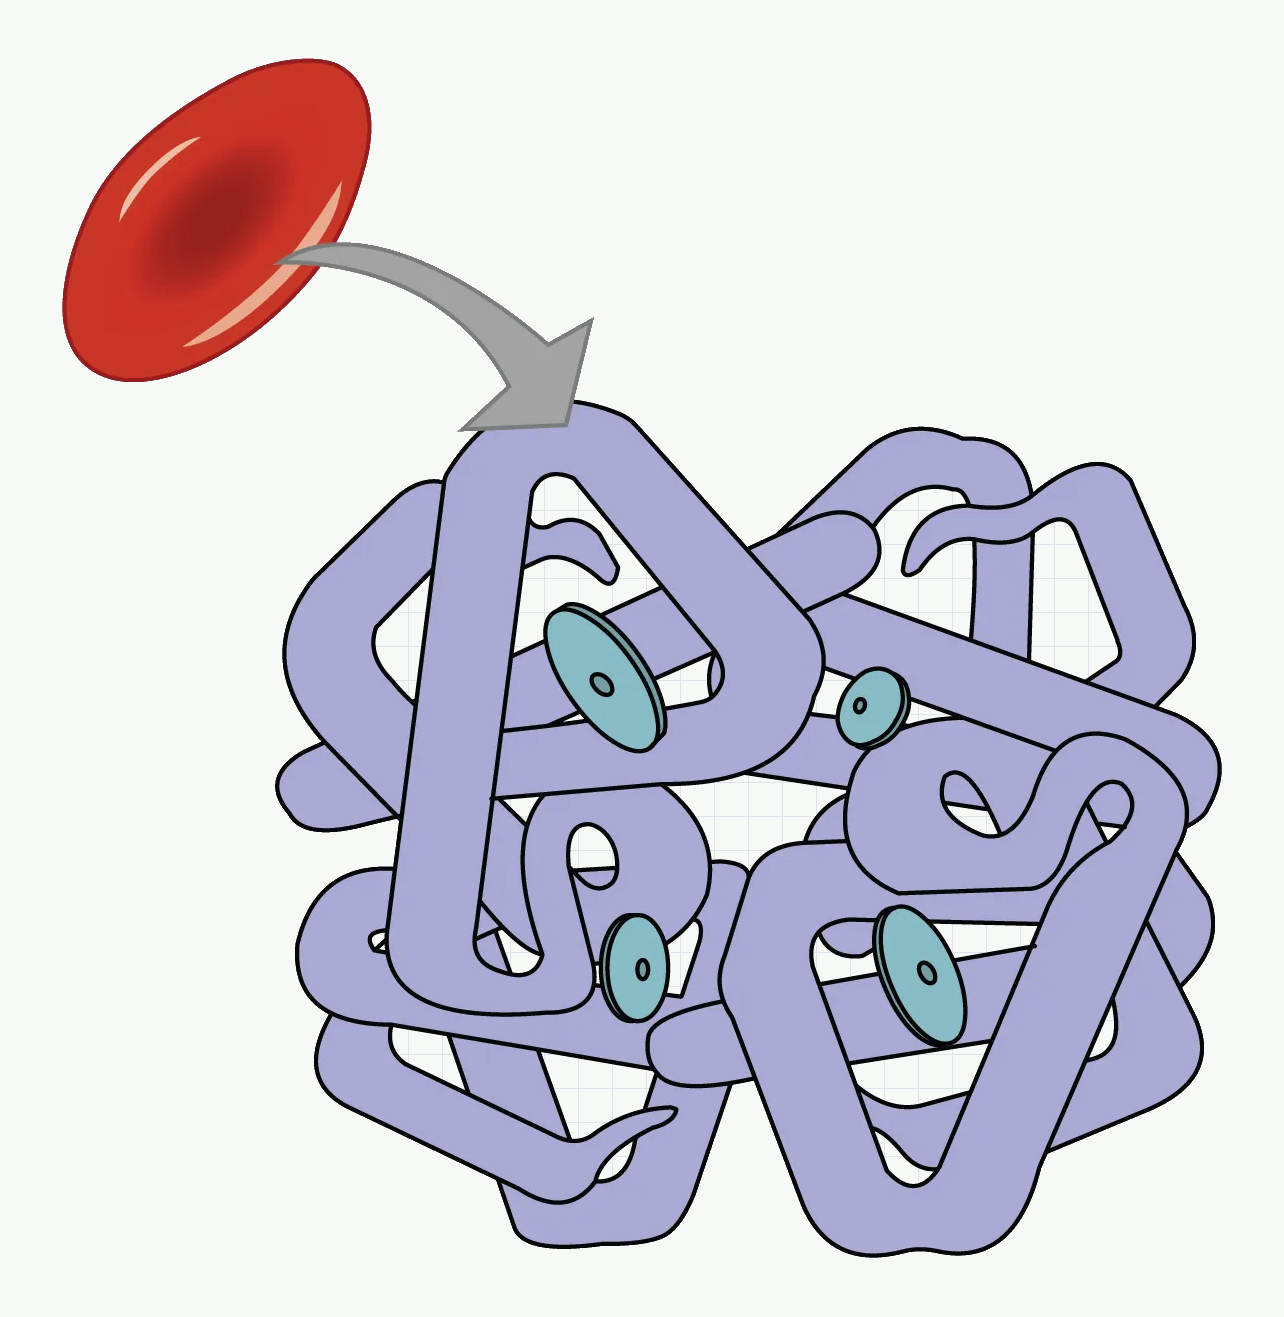
#f7f9f7; diagram labels and line work unchanged. Source link: https://openstax.org/books/anatomy-and-physiology-2e/pages/22-5-transport-of-gases.How to use this figure: Use the four haem groups to anchor the content equation: oxygen content collapses when haemoglobin concentration falls, even if saturation is normal.
Adult haemoglobin A consists of four globin chains:
- two alpha chains,
- two beta chains.
Each globin chain contains one haem group. Each haem group contains one ferrous iron ion, Fe²⁺, which can bind one oxygen molecule.
Therefore one haemoglobin molecule can bind up to four oxygen molecules.
Important terms:
| Term | Meaning |
|---|---|
| Deoxyhaemoglobin | Hb without bound oxygen |
| Oxyhaemoglobin | Hb with oxygen bound |
| Carboxyhaemoglobin | Hb bound to carbon monoxide |
| Methaemoglobin | Hb with iron oxidised to Fe³⁺ |
| Fetal haemoglobin | HbF, α₂γ₂, higher O₂ affinity |
Cooperative binding
Haemoglobin shows positive cooperativity.
When one oxygen molecule binds to haemoglobin, the molecule changes shape and the remaining binding sites bind oxygen more easily. Likewise, when one oxygen molecule is released, the remaining oxygen molecules are released more readily.
This produces the sigmoid shape of the oxyhaemoglobin dissociation curve.
Physiological advantage:
- In the lungs, haemoglobin loads oxygen efficiently over a range of alveolar PO₂.
- In tissues, small falls in PO₂ produce large oxygen unloading.
Haemoglobin versus myoglobin
Myoglobin is an oxygen-binding protein in muscle. It has one haem group and binds one oxygen molecule.
| Feature | Haemoglobin | Myoglobin |
|---|---|---|
| Location | Red blood cells | Muscle |
| Structure | 4 subunits | 1 subunit |
| Binding curve | Sigmoid | Hyperbolic |
| Cooperativity | Yes | No |
| Function | Transport | Storage/facilitated diffusion in muscle |
| O₂ affinity | Lower than myoglobin | High |
Myoglobin holds oxygen at low PO₂ and releases it when muscle oxygen tension becomes very low.
Quick check: haemoglobin binding
How many oxygen molecules can one haemoglobin molecule carry?
Reveal answer
One haemoglobin molecule has four haem groups and can bind four oxygen molecules when fully saturated.
Why is the haemoglobin-oxygen curve sigmoid?
Reveal answer
Positive cooperativity: binding of one oxygen molecule increases affinity at the remaining sites, so loading accelerates as saturation rises.
Why is myoglobin not a delivery protein like haemoglobin?
Reveal answer
Myoglobin has very high oxygen affinity and a hyperbolic curve, so it stores oxygen in muscle and releases it mainly at very low PO2.
The Haemoglobin-Oxygen Dissociation Curve
What the curve shows
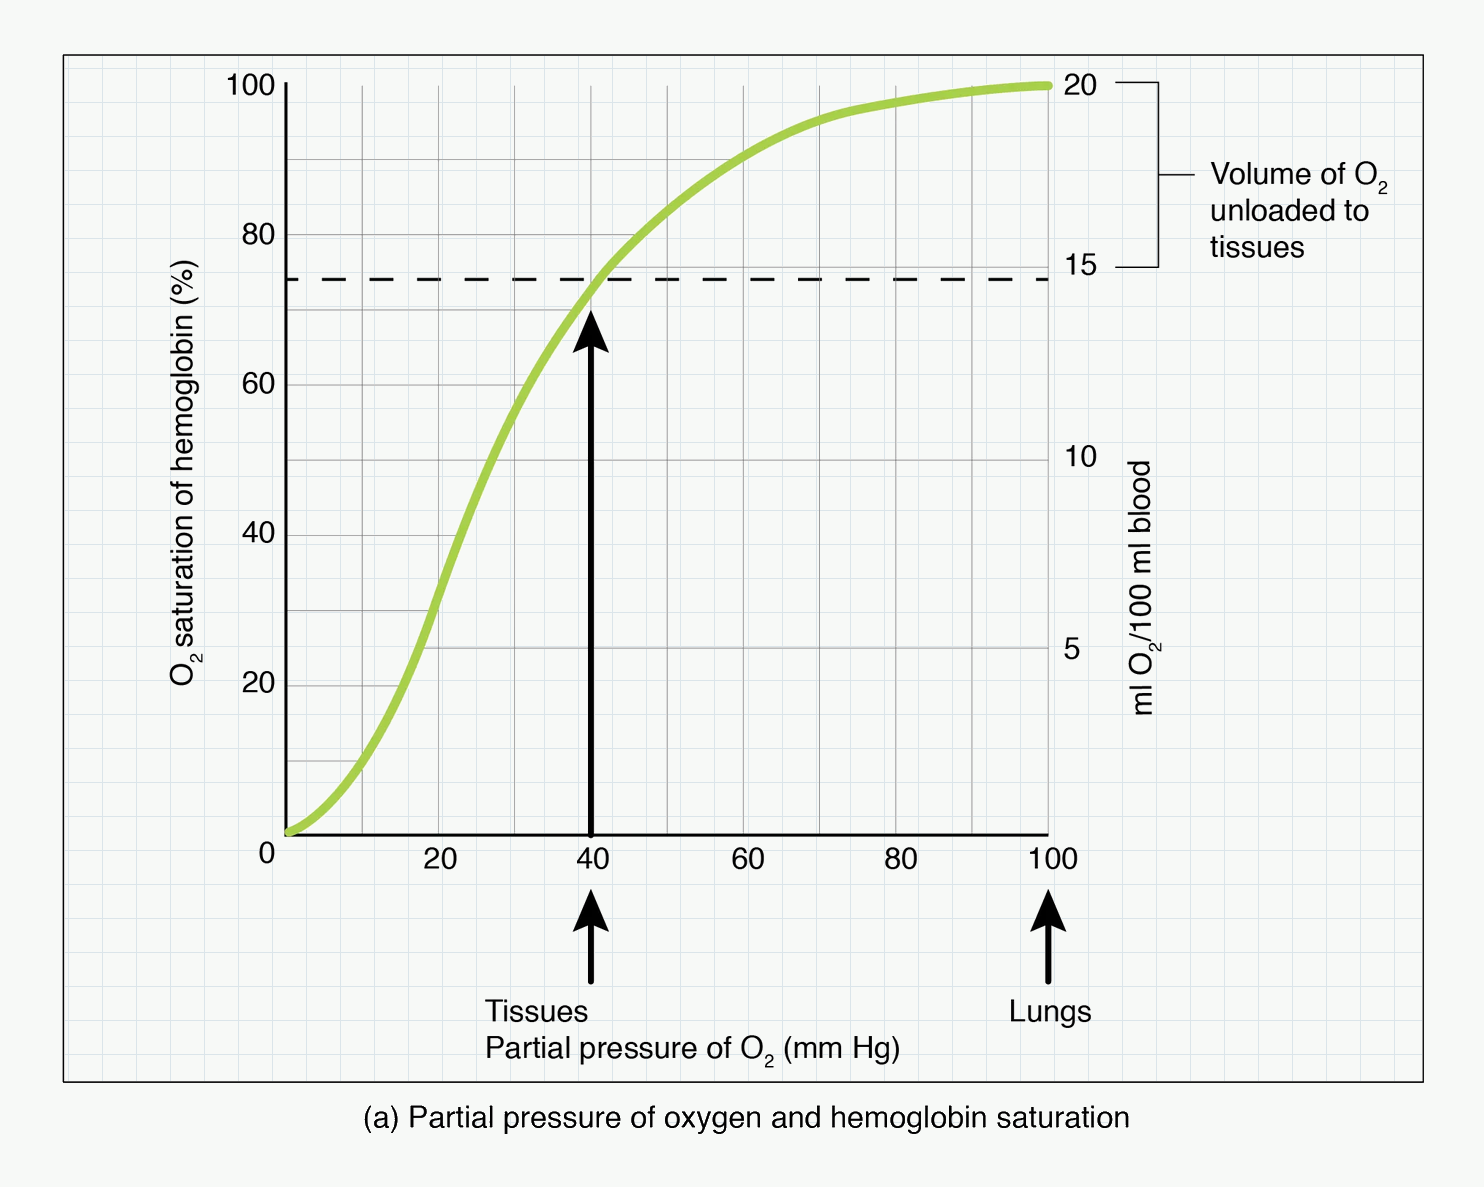
#f7f9f7; diagram labels and line work unchanged. Source link: https://openstax.org/books/anatomy-and-physiology-2e/pages/22-5-transport-of-gases.Abbreviations shown: O₂ = oxygen; mm Hg = millimetres of mercury.
How to use this figure: Read the plateau as pulmonary reserve and the steep portion as tissue unloading. The common exam error is to treat a normal saturation as proof of normal oxygen delivery.
The haemoglobin–oxygen dissociation curve plots:
- oxygen saturation of haemoglobin on the y-axis,
- oxygen partial pressure, PO₂, on the x-axis.
It shows the relationship between PaO₂ and SaO₂.
The curve is sigmoid because of cooperative binding.
The plateau and the steep part
The curve has two clinically important regions.
Plateau
At PaO₂ above about 8 kPa, the curve is relatively flat. This means a moderate fall in PaO₂ causes little fall in saturation.
Clinical advantage:
- It protects arterial saturation against moderate changes in alveolar oxygen.
- At normal sea level PaO₂, haemoglobin remains highly saturated.
Clinical warning:
- A patient can lose a lot of PaO₂ before SpO₂ falls significantly.
- SpO₂ is a late warning of falling PaO₂ on the plateau.
Steep part
At PaO₂ below about 8 kPa, the curve becomes steep. Small falls in PaO₂ produce large falls in saturation.
Clinical importance:
- Tissue capillaries sit on the steep part, promoting oxygen unloading.
- During desaturation, SpO₂ can fall rapidly once PaO₂ reaches this range.
P50
P50 is the PO₂ at which haemoglobin is 50% saturated.
Normal adult P50 is approximately:
- 3.5 kPa, or
- 26–27 mmHg.
P50 is an index of haemoglobin affinity for oxygen.
| Change | Meaning |
|---|---|
| Increased P50 | Lower Hb affinity; right shift; easier unloading |
| Decreased P50 | Higher Hb affinity; left shift; harder unloading |
Remember:
Right shift = release. Left shift = loading.
But this is a simplification. Left shift helps loading in the lung but may impair unloading in tissues. Right shift helps unloading but may reduce loading if pulmonary oxygen tension is low.
Right shift of the curve
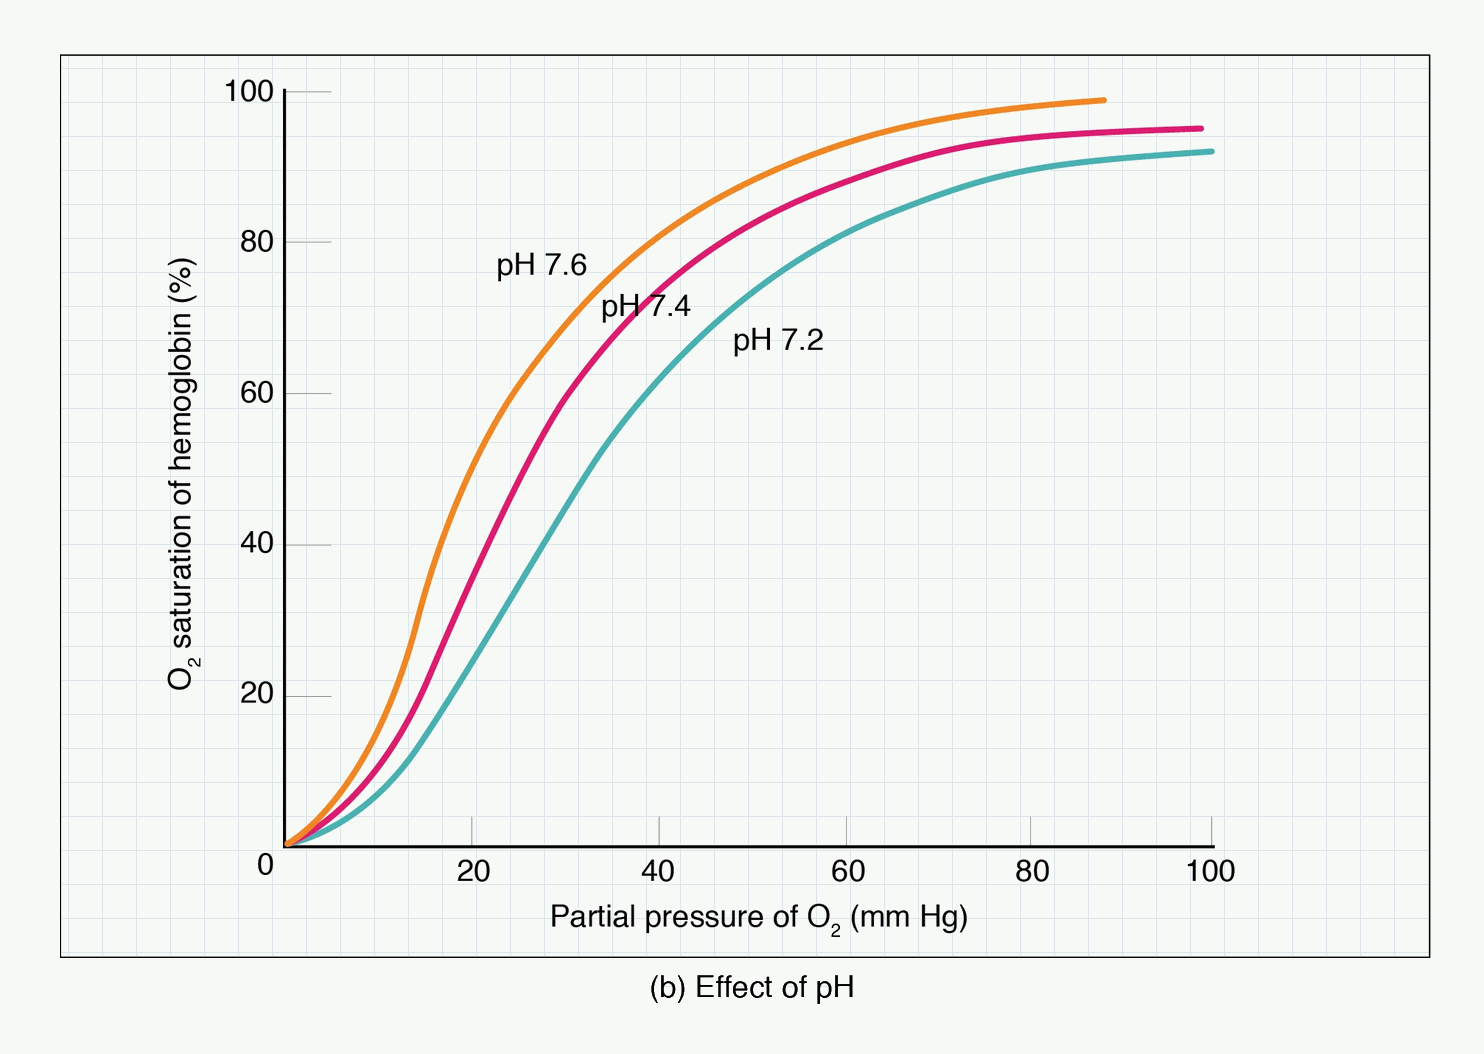
#f7f9f7; diagram labels and line work unchanged. Source link: https://openstax.org/books/anatomy-and-physiology-2e/pages/22-5-transport-of-gases.Abbreviations shown: O₂ = oxygen; pH = acidity/alkalinity scale; mm Hg = millimetres of mercury.
How to use this figure: Follow the lower pH curve to see why active, acidotic tissues unload more oxygen. Then reverse the logic for alkalosis and hypothermia: loading may improve, but unloading can become harder.
A right shift means haemoglobin has reduced oxygen affinity. At any given PO₂, saturation is lower and oxygen unloading is easier.
Causes of right shift:
- increased H⁺ / reduced pH,
- increased PaCO₂,
- increased temperature,
- increased 2,3-DPG,
- exercise,
- chronic hypoxaemia,
- anaemia,
- high altitude adaptation.
Mnemonic:
CADET, face Right
- C = CO₂,
- A = Acid,
- D = 2,3-DPG,
- E = Exercise,
- T = Temperature.
Clinical examples:
- Exercising muscle is warm, acidic, and CO₂-rich, so the curve shifts right and oxygen unloading improves.
- Sepsis and fever may shift the curve right, but oxygen delivery may still be poor because of vasodilation, maldistribution, and mitochondrial dysfunction.
- Chronic anaemia increases 2,3-DPG, improving unloading.
Left shift of the curve
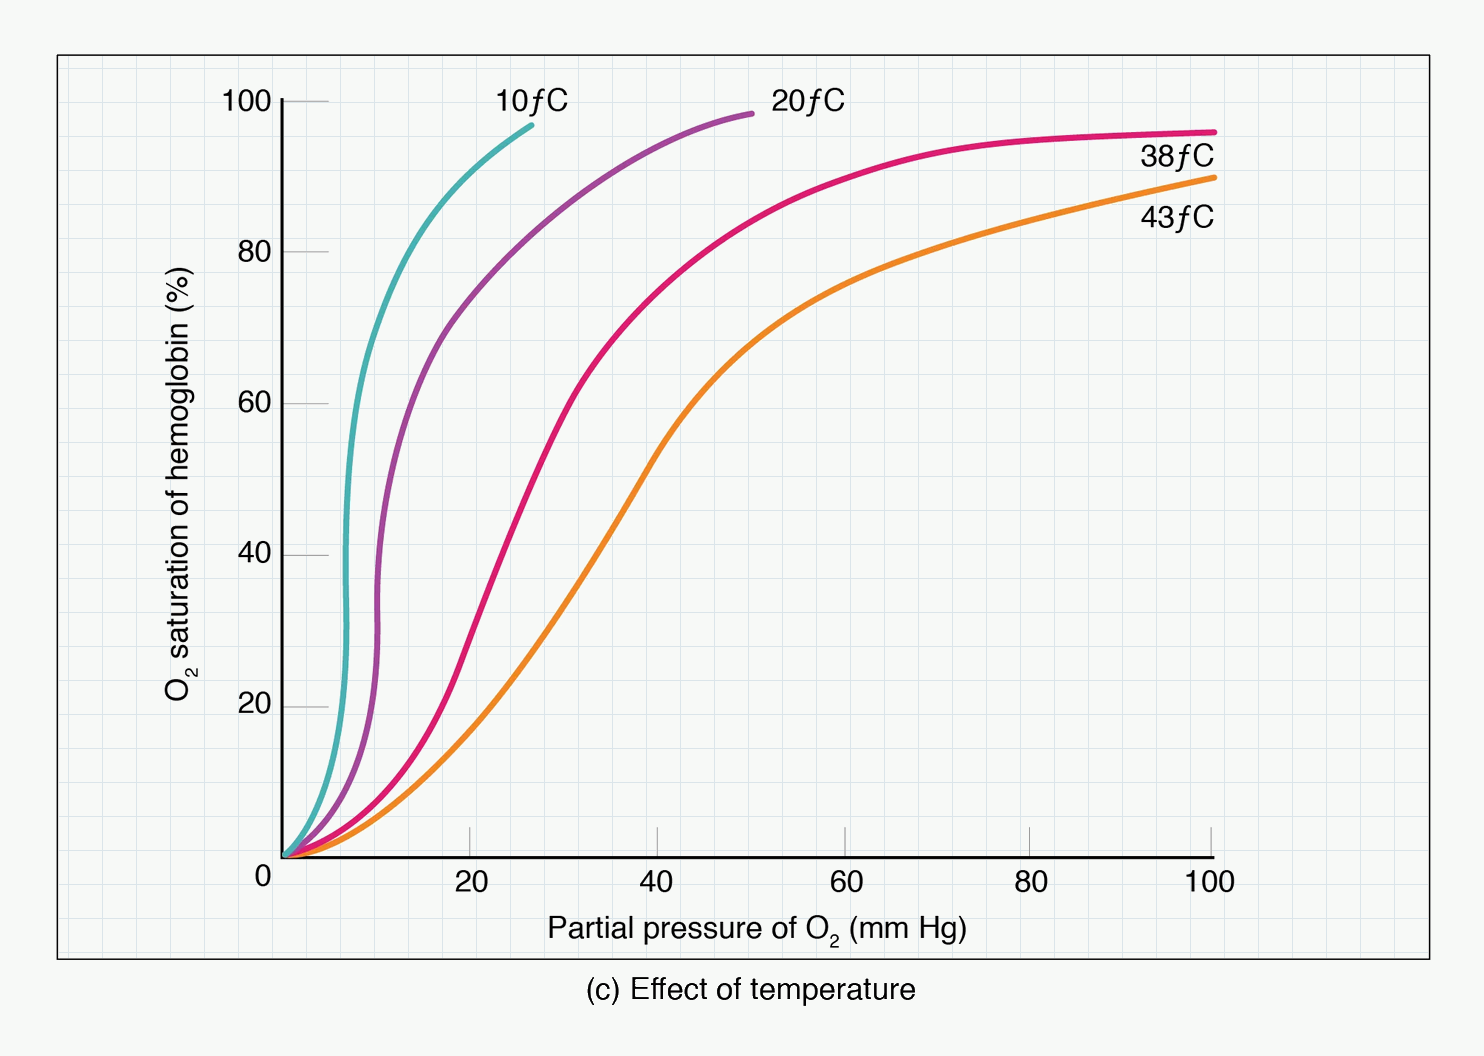
#f7f9f7; diagram labels and line work unchanged. Source link: https://openstax.org/books/anatomy-and-physiology-2e/pages/22-5-transport-of-gases.Abbreviations shown: O₂ = oxygen; mm Hg = millimetres of mercury; °C = degrees Celsius.
How to use this figure: Use this with perioperative temperature changes: fever supports unloading, while hypothermia increases affinity and may impair peripheral oxygen release.
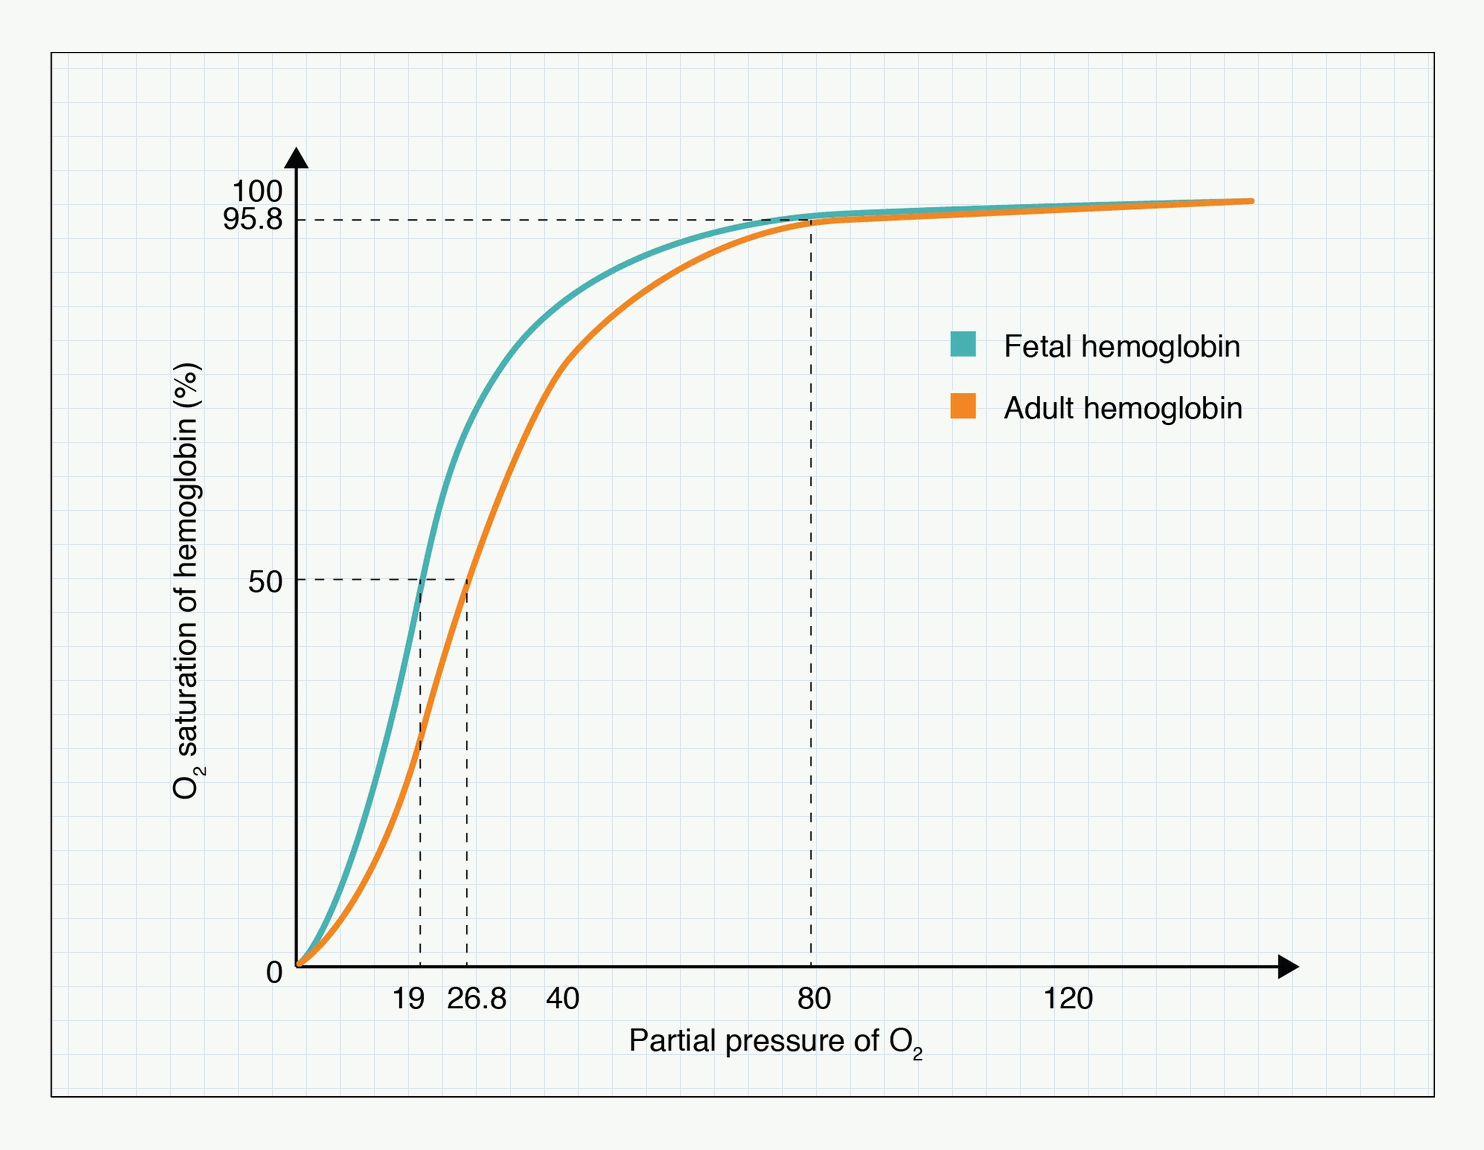
#f7f9f7; diagram labels and line work unchanged. Source link: https://openstax.org/books/anatomy-and-physiology-2e/pages/22-5-transport-of-gases.Abbreviations shown: O₂ = oxygen; Hb = haemoglobin; mm Hg = millimetres of mercury.
How to use this figure: Notice that fetal haemoglobin sits left of adult haemoglobin. That higher affinity is useful at the placenta but would be a poor general strategy for adult tissue unloading.
A left shift means haemoglobin has increased oxygen affinity. At any given PO₂, saturation is higher and oxygen unloading is harder.
Causes of left shift:
- reduced H⁺ / alkalosis,
- reduced PaCO₂,
- reduced temperature,
- reduced 2,3-DPG,
- fetal haemoglobin,
- carboxyhaemoglobin,
- methaemoglobin,
- some abnormal haemoglobins,
- stored blood.
Clinical examples:
- Hypothermia shifts the curve left, making unloading harder.
- Hyperventilation lowers PaCO₂ and shifts the curve left.
- Stored blood has reduced 2,3-DPG, causing a left shift.
- Carbon monoxide both reduces oxygen-carrying capacity and shifts the remaining curve left.
Bohr effect
The Bohr effect describes the effect of CO₂ and H⁺ on haemoglobin oxygen affinity.
In tissues:
- CO₂ is high,
- H⁺ is high,
- pH is lower,
- curve shifts right,
- oxygen unloading increases.
In lungs:
- CO₂ is excreted,
- H⁺ falls,
- pH rises,
- curve shifts left,
- oxygen loading improves.
Definition:
The Bohr effect is the reduction in haemoglobin oxygen affinity caused by increased CO₂ or H⁺ concentration, promoting oxygen unloading in metabolically active tissues.
Haldane effect — brief link
The Haldane effect is mainly a CO₂ transport concept and will be covered in Module 1.5. For now:
- oxygenation of haemoglobin in the lungs reduces its ability to carry CO₂,
- deoxygenated haemoglobin in tissues carries CO₂ and buffers H⁺ better.
This helps CO₂ loading in tissues and CO₂ unloading in lungs.
2,3-DPG
2,3-diphosphoglycerate, or 2,3-DPG, is produced in red blood cells during glycolysis.
It binds deoxyhaemoglobin and stabilises the deoxygenated state, reducing oxygen affinity.
Effects:
- increased 2,3-DPG → right shift → easier oxygen unloading,
- decreased 2,3-DPG → left shift → harder oxygen unloading.
Increased 2,3-DPG occurs in:
- chronic anaemia,
- chronic hypoxaemia,
- high altitude,
- pregnancy.
Decreased 2,3-DPG occurs in:
- stored blood,
- hypophosphataemia,
- severe illness in some contexts.
Clinical point:
Stored red cells may initially unload oxygen less readily because 2,3-DPG is depleted. Levels recover after transfusion over time.
Fetal haemoglobin
Fetal haemoglobin, HbF, consists of:
- two alpha chains,
- two gamma chains.
HbF binds 2,3-DPG less avidly than adult haemoglobin. Therefore HbF has higher oxygen affinity and the HbO₂ curve is shifted left.
Physiological purpose:
- HbF can extract oxygen from maternal haemoglobin across the placenta.
Clinical implication:
- Fetal oxygen loading is favoured at low placental PO₂.
- Oxygen unloading to fetal tissues is supported by other fetal adaptations, including higher haemoglobin concentration and fetal circulation.
Temperature
Temperature affects haemoglobin affinity.
| Temperature change | Curve shift | Effect |
|---|---|---|
| Increased temperature | Right | Easier unloading |
| Decreased temperature | Left | Harder unloading |
Clinical examples:
- Fever and exercise promote unloading.
- Hypothermia can impair tissue oxygen unloading despite good saturation.
- During cardiopulmonary bypass and hypothermia, oxygen tension interpretation is more complex and depends on temperature correction strategy.
Quick check: curve shifts
What does P50 tell you?
Reveal answer
P50 is the PO2 at which haemoglobin is 50% saturated. A higher P50 means lower affinity and right shift; a lower P50 means higher affinity and left shift.
Which changes shift the curve right and why does that matter?
Reveal answer
Increased CO2, acid, 2,3-DPG, exercise, and temperature shift right. This promotes unloading, especially in active, warm, acidotic tissues.
Why can a left shift be dangerous despite high saturation?
Reveal answer
A left shift increases affinity, so haemoglobin may load well but release oxygen poorly in tissues. Causes include hypothermia, alkalosis, HbF, COHb, MetHb, low 2,3-DPG, and stored blood.
Dys-haemoglobins and Special Oxygen Problems
Carbon monoxide poisoning
Carbon monoxide binds haemoglobin with much higher affinity than oxygen.
Effects:
- It occupies oxygen-binding sites, reducing oxygen-carrying capacity.
- It shifts the HbO₂ curve left, so remaining bound oxygen is unloaded less easily.
- It impairs cellular oxygen use by binding other haem proteins.
Key features:
- PaO₂ may be normal because dissolved oxygen is normal.
- Standard pulse oximetry may be falsely reassuring because it cannot reliably distinguish oxyhaemoglobin from carboxyhaemoglobin.
- Co-oximetry is needed to measure carboxyhaemoglobin.
Treatment principles:
- remove from exposure,
- give high-flow 100% oxygen,
- consider hyperbaric oxygen in selected severe cases or high-risk patients according to local policy.
Exam trap:
Carbon monoxide poisoning causes tissue hypoxia with a normal PaO₂.
Methaemoglobinaemia
Methaemoglobin contains iron in the ferric form, Fe³⁺, instead of ferrous Fe²⁺. Ferric iron cannot bind oxygen normally.
Effects:
- reduces oxygen-carrying capacity,
- shifts the curve left for remaining normal haem groups,
- impairs oxygen unloading.
Causes include:
- prilocaine,
- benzocaine,
- nitrates/nitrites,
- dapsone,
- local anaesthetic overdose in susceptible patients,
- congenital enzyme defects.
Clinical features:
- cyanosis out of proportion to PaO₂,
- low SpO₂ often around the mid-80s and poorly responsive to oxygen,
- chocolate-brown blood,
- dyspnoea, confusion, arrhythmia or seizures if severe.
Diagnosis:
- co-oximetry.
Treatment:
- stop offending agent,
- give oxygen,
- methylene blue for significant symptomatic cases, unless contraindicated,
- consider specialist advice, especially in G6PD deficiency or severe cases.
Sickle cell disease
In sickle cell disease, deoxygenated HbS polymerises, causing red cell sickling.
Triggers for sickling:
- hypoxaemia,
- acidosis,
- hypothermia,
- dehydration,
- stasis,
- infection,
- pain and stress.
Anaesthetic priorities:
- avoid hypoxia,
- avoid hypothermia,
- avoid acidosis,
- avoid dehydration,
- maintain perfusion,
- treat pain,
- consider transfusion strategy in selected patients according to surgical risk and local guidance.
This is an oxygen transport disease where maintaining oxygenation is necessary but not sufficient; perfusion, temperature, acid-base state, and hydration also matter.
Quick check: dys-haemoglobins
What are the two haemoglobin effects of carbon monoxide?
Reveal answer
Carbon monoxide occupies oxygen-binding sites, reducing content, and shifts the remaining haemoglobin-oxygen curve left, impairing unloading.
Why can pulse oximetry be falsely reassuring in carbon monoxide poisoning?
Reveal answer
Standard pulse oximetry cannot reliably distinguish oxyhaemoglobin from carboxyhaemoglobin, so SpO2 may look acceptable while effective oxygen content is low.
What is the core defect in methaemoglobinaemia?
Reveal answer
Iron is oxidised to the ferric form, which cannot bind oxygen normally, while remaining normal haem groups hold oxygen more tightly and unload less well.
The Oxygen Cascade
Definition
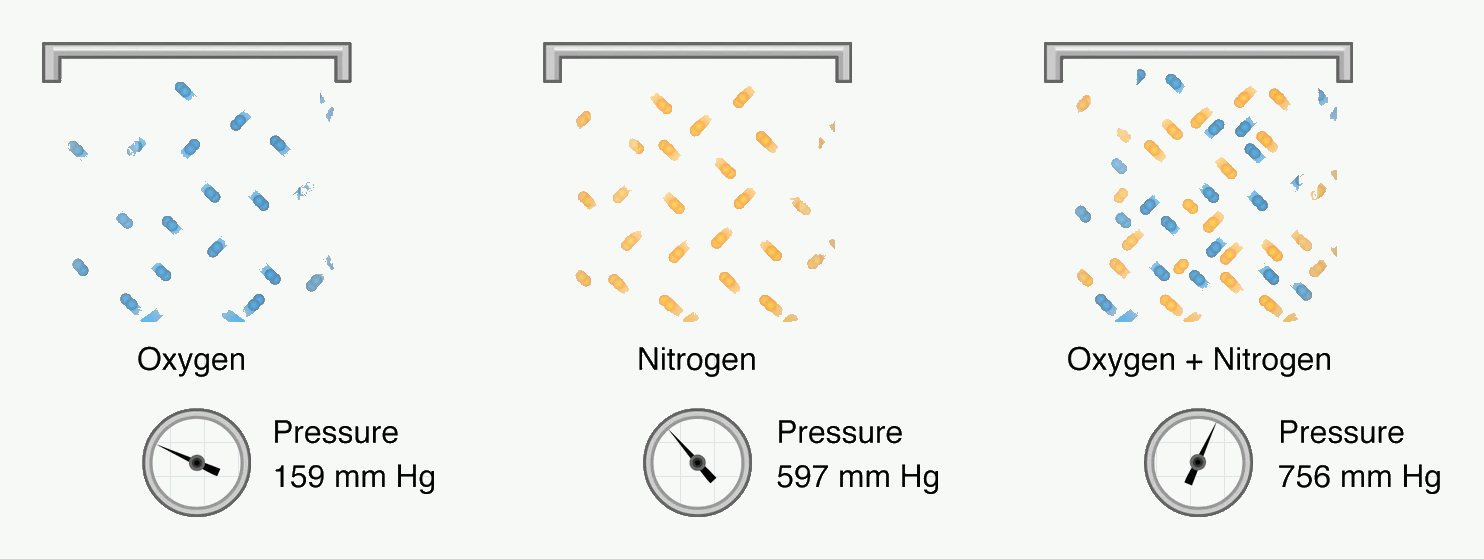
#f7f9f7; diagram labels and line work unchanged. Source link: https://openstax.org/books/anatomy-and-physiology-2e/pages/22-4-gas-exchange.Abbreviations shown: mm Hg = millimetres of mercury.
How to use this figure: Use this before the alveolar gas equation: oxygen fraction is not the same as oxygen pressure. Barometric pressure, humidification, and carbon dioxide all change the pressure available for oxygen transfer.
The oxygen cascade describes the progressive fall in oxygen partial pressure from the atmosphere to the mitochondria.
A practical definition:
The oxygen cascade is the stepwise decrease in oxygen partial pressure from inspired air to alveoli, arterial blood, tissues, and mitochondria, reflecting humidification, alveolar ventilation, diffusion, perfusion, tissue extraction, and cellular oxygen use.
Why oxygen partial pressure falls step by step
Oxygen partial pressure decreases because:
- inspired gas is humidified,
- alveolar gas contains CO₂,
- alveolar gas mixes with residual lung gas,
- oxygen diffuses from alveoli into blood,
- small venous admixture lowers arterial PO₂,
- oxygen leaves capillary blood for tissues,
- mitochondria consume oxygen.
Oxygen cascade values at sea level on air
Approximate values:
| Step | Approximate PO₂ |
|---|---|
| Dry atmospheric PO₂ | 21.2 kPa |
| Humidified inspired PO₂ | 19.9 kPa |
| Alveolar PO₂ | 13.3 kPa |
| Arterial PaO₂ | 10–13 kPa |
| Mixed venous PO₂ | ~5.3 kPa |
| Tissue PO₂ | Variable, often ~3–5 kPa |
| Mitochondrial PO₂ | Very low, roughly ~0.5–3 kPa |
Do not over-memorise tissue and mitochondrial numbers; they vary by organ and metabolic state. The important principle is the progressive fall.
Dry Atmospheric Oxygen
At sea level:
- barometric pressure, PB, is about 101.3 kPa,
- oxygen fraction in dry air is about 0.21.
Dry atmospheric PO₂:
PO₂ = FiO₂ × PB
PO₂ = 0.21 × 101.3 ≈ 21.2 kPa
At altitude, FiO₂ remains about 0.21 but barometric pressure falls, so inspired PO₂ falls.
Humidified Inspired Oxygen
When air enters the upper airway, it is warmed and humidified. At 37°C, saturated water vapour pressure is:
- 6.3 kPa, or
- 47 mmHg.
Water vapour occupies part of the total pressure, reducing the pressure available for oxygen and nitrogen.
Humidified inspired oxygen tension:
PIO₂ = FiO₂ × (PB − PH₂O)
On air at sea level:
PIO₂ = 0.21 × (101.3 − 6.3)
PIO₂ ≈ 19.9 kPa
Clinical implication:
- humidification is physiologically essential,
- but it lowers inspired oxygen partial pressure slightly,
- at altitude this reduction is more significant because barometric pressure is already low.
Alveolar Oxygen and Carbon Dioxide
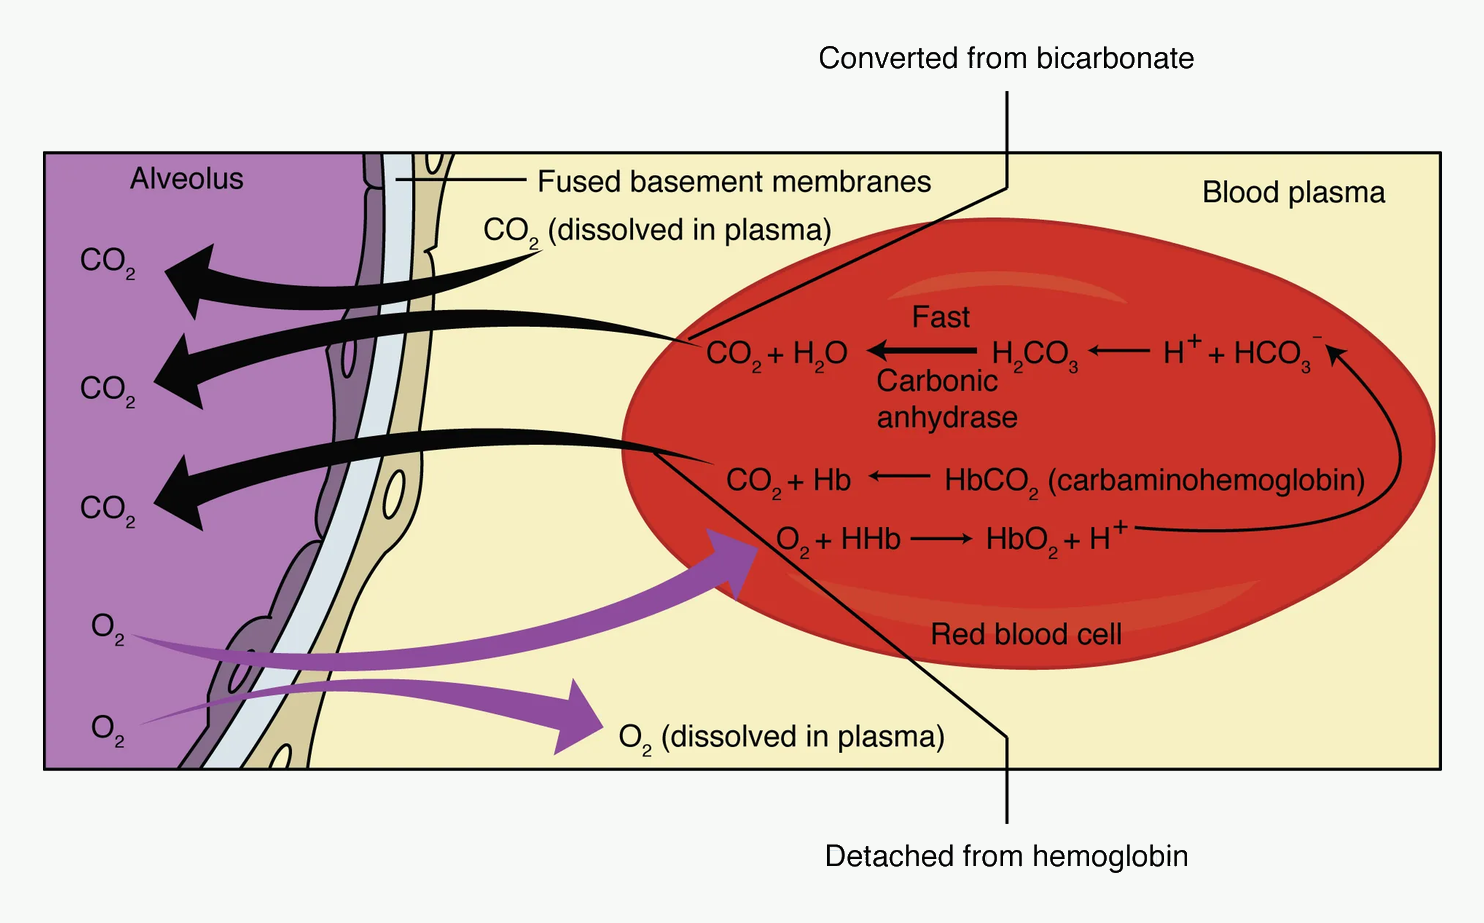
#f7f9f7; diagram labels and line work unchanged. Source link: https://openstax.org/books/anatomy-and-physiology-2e/pages/22-4-gas-exchange.Abbreviations shown: CO₂ = carbon dioxide; O₂ = oxygen; H₂O = water; H₂CO₃ = carbonic acid; HCO₃⁻ = bicarbonate; H⁺ = hydrogen ion; Hb = haemoglobin; HbO₂ = oxyhaemoglobin; HHb = deoxyhaemoglobin.
How to use this figure: Track direction first: oxygen enters blood and carbon dioxide leaves it. Then add chemistry: oxygen loading promotes carbon dioxide unloading, which is the Haldane effect.
Alveolar gas contains carbon dioxide. Because total alveolar pressure is fixed by barometric pressure and water vapour, the presence of CO₂ reduces alveolar oxygen pressure.
This relationship is described by the alveolar gas equation.
Quick check: oxygen cascade
What is the key direction of the oxygen cascade?
Reveal answer
PO2 progressively falls from atmosphere to humidified inspired gas, alveolus, arterial blood, mixed venous blood, tissues, and mitochondria.
Why is inspired oxygen pressure lower after humidification?
Reveal answer
Water vapour occupies part of the total pressure at body temperature, leaving less pressure available for oxygen and nitrogen.
What does low PaO2 after normal or high PAO2 suggest?
Reveal answer
It suggests an alveolar-to-arterial transfer problem such as V/Q mismatch, shunt, or diffusion limitation rather than simply low inspired oxygen.
The Alveolar Gas Equation
Simplified alveolar gas equation
The clinically useful simplified equation is:
PAO₂ = PIO₂ − (PaCO₂ / R)
where:
- PAO₂ = alveolar oxygen tension,
- PIO₂ = inspired oxygen tension after humidification,
- PaCO₂ = arterial carbon dioxide tension, used as an estimate of alveolar CO₂,
- R = respiratory quotient, usually about 0.8.
On air at sea level:
PAO₂ = 19.9 − (5.3 / 0.8)
PAO₂ = 19.9 − 6.6
PAO₂ ≈ 13.3 kPa
This is why alveolar PO₂ is much lower than humidified inspired PO₂.
What the equation teaches clinically
The alveolar gas equation shows that PAO₂ falls if:
- FiO₂ falls,
- barometric pressure falls,
- water vapour pressure rises slightly with temperature,
- PaCO₂ rises from hypoventilation,
- respiratory quotient changes.
The most important bedside lesson is:
Hypoventilation raises PaCO₂ and therefore lowers PAO₂.
This is why a patient who is hypoventilating needs ventilation, not just oxygen.
Effect of hypoventilation
Example:
On air at sea level, if PaCO₂ rises from 5.3 kPa to 8 kPa:
PAO₂ = 19.9 − (8 / 0.8)
PAO₂ = 19.9 − 10
PAO₂ ≈ 9.9 kPa
Alveolar oxygen falls because carbon dioxide occupies more of the alveolar gas pressure.
Clinical examples:
- opioid overdose,
- residual neuromuscular blockade,
- severe COPD with ventilatory failure,
- obesity hypoventilation,
- brainstem depression,
- inadequate minute ventilation during anaesthesia.
Effect of increasing FiO₂
If FiO₂ is increased to 1.0 at sea level:
PIO₂ = 1.0 × (101.3 − 6.3) ≈ 95 kPa
If PaCO₂ is 5.3 kPa:
PAO₂ = 95 − (5.3 / 0.8)
PAO₂ ≈ 88 kPa
This explains why high FiO₂ creates a large alveolar oxygen reservoir, useful during preoxygenation.
The A–a gradient
The alveolar–arterial oxygen gradient is:
A–a gradient = PAO₂ − PaO₂
It compares calculated alveolar oxygen tension with measured arterial oxygen tension.
Normal approximate value on air in a young adult:
- about 1–2 kPa, or
- about 5–15 mmHg.
It increases with age and higher FiO₂.
Why PaO₂ is lower than PAO₂ normally
Even in healthy people, PaO₂ is lower than PAO₂ because of:
- small physiological shunt,
- venous admixture from bronchial and Thebesian veins,
- mild V/Q inequality,
- diffusion limitations under extreme conditions.
Clinical use of the A–a gradient
| Situation | PAO₂ | PaO₂ | A–a gradient | Interpretation |
|---|---|---|---|---|
| Low inspired oxygen | Low | Low | Normal | Cascade starts low |
| Pure hypoventilation | Low | Low | Usually normal | Alveolar O₂ low because CO₂ high |
| V/Q mismatch | Often normal or low | Low | Increased | Lung gas exchange abnormal |
| Shunt | Normal/high with O₂ | Low | Increased | Blood bypasses ventilated alveoli |
| Diffusion limitation | Normal | Low, especially exercise | Increased | Transfer barrier problem |
Important exam statement:
A normal A–a gradient suggests hypoventilation or low inspired oxygen. A widened A–a gradient suggests a gas exchange problem such as V/Q mismatch, shunt, or diffusion limitation.
Module 1.5 will develop V/Q mismatch, shunt, and diffusion in more detail.
Quick check: alveolar gas equation
What is the simplified alveolar gas equation?
Reveal answer
PAO2 = PIO2 - (PaCO2 / R), where R is usually about 0.8. It shows how inspired oxygen and ventilation determine alveolar oxygen.
Why does hypoventilation lower alveolar oxygen?
Reveal answer
Hypoventilation raises PaCO2. Because total alveolar gas pressure is limited, more CO2 leaves less pressure for oxygen, reducing PAO2.
How does the A-a gradient separate mechanisms of hypoxaemia?
Reveal answer
A normal A-a gradient points toward low inspired oxygen or hypoventilation. A widened A-a gradient points toward V/Q mismatch, shunt, or diffusion limitation.
Oxygen Delivery and Consumption
Oxygen delivery
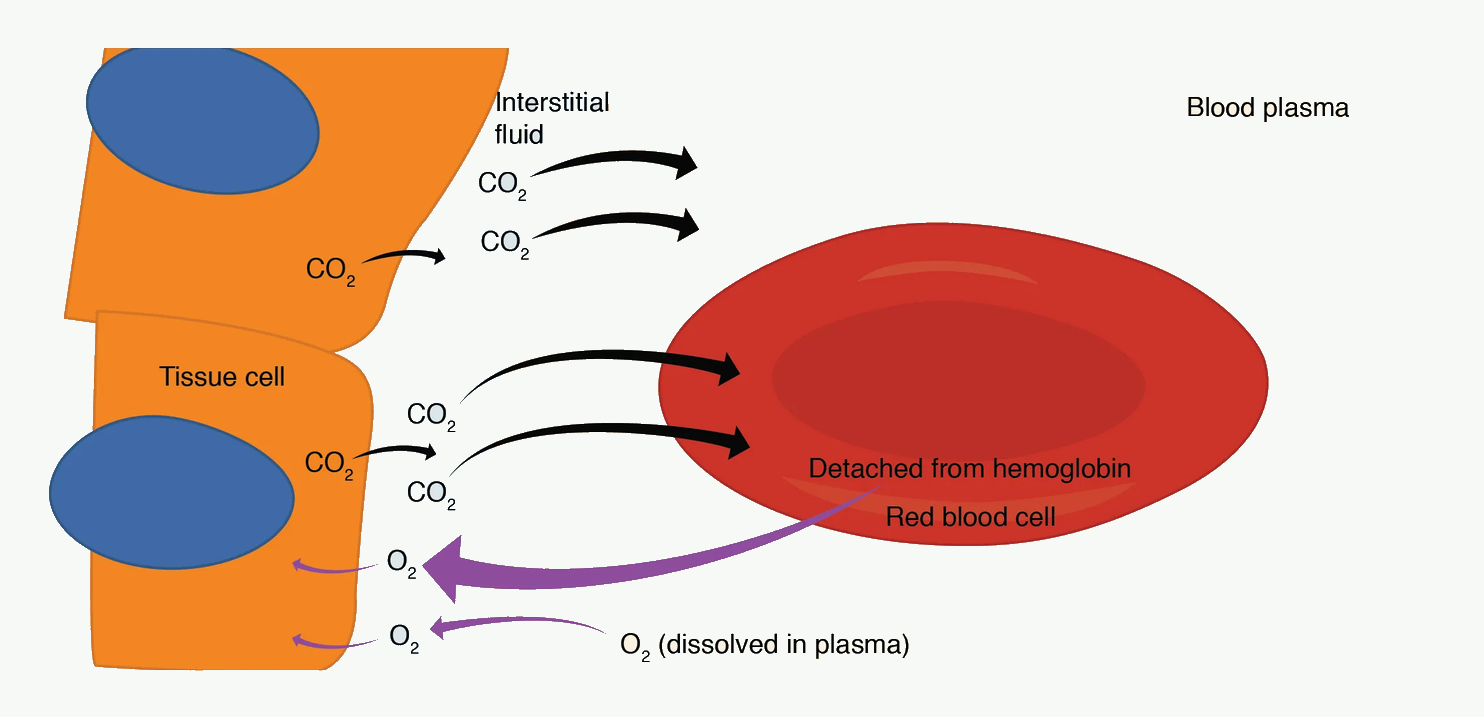
#f7f9f7; diagram labels and line work unchanged. Source link: https://openstax.org/books/anatomy-and-physiology-2e/pages/22-4-gas-exchange.Abbreviations shown: CO₂ = carbon dioxide; O₂ = oxygen; H₂O = water; H₂CO₃ = carbonic acid; HCO₃⁻ = bicarbonate; H⁺ = hydrogen ion; Hb = haemoglobin; HbO₂ = oxyhaemoglobin; HHb = deoxyhaemoglobin.
How to use this figure: Pair this figure with DO₂ and extraction. Tissues can receive normal PaO₂ yet still fail if haemoglobin, cardiac output, extraction, or mitochondrial use is impaired.
Oxygen delivery, DO₂, is the amount of oxygen delivered to tissues each minute.
It depends on:
- arterial oxygen content,
- cardiac output.
Equation:
DO₂ = Cardiac output × CaO₂
Because CaO₂ is usually in mL/dL and cardiac output is in L/min, multiply by 10 to convert L to dL:
DO₂ = CO × CaO₂ × 10
Normal example:
- CO = 5 L/min,
- CaO₂ = 20 mL/dL.
DO₂ = 5 × 20 × 10 = 1000 mL O₂/min
Normal adult oxygen delivery is approximately 1000 mL/min.
Determinants of DO₂
Because CaO₂ depends mainly on haemoglobin and saturation, DO₂ depends on:
- cardiac output,
- haemoglobin concentration,
- arterial oxygen saturation,
- PaO₂ to a small extent.
Expanded equation:
DO₂ = CO × [(1.34 × Hb × SaO₂) + dissolved O₂] × 10
Therefore, oxygen delivery can fail because of:
| Problem | Example |
|---|---|
| Low cardiac output | Cardiogenic shock, hypovolaemia, tamponade |
| Low haemoglobin | Haemorrhage, anaemia |
| Low saturation | Pneumonia, airway obstruction, shunt |
| Abnormal Hb | CO poisoning, methaemoglobinaemia |
| Maldistributed flow | Sepsis, microcirculatory failure |
Oxygen consumption
Oxygen consumption, VO₂, is the amount of oxygen used by tissues each minute.
Normal adult VO₂ at rest is approximately:
- 250 mL/min, or
- about 3–4 mL/kg/min.
The Fick principle gives:
VO₂ = CO × (CaO₂ − CvO₂) × 10
where CvO₂ is mixed venous oxygen content.
Oxygen consumption increases with:
- fever,
- shivering,
- pain,
- agitation,
- seizures,
- sepsis,
- work of breathing,
- burns,
- hyperthyroidism,
- pregnancy,
- paediatric physiology.
Oxygen consumption decreases with:
- anaesthesia,
- hypothermia,
- sedation,
- paralysis,
- reduced metabolic activity.
Oxygen extraction ratio
Oxygen extraction ratio, OER, is the fraction of delivered oxygen extracted by tissues.
OER = VO₂ / DO₂
Normally:
- DO₂ ≈ 1000 mL/min,
- VO₂ ≈ 250 mL/min,
- OER ≈ 25%.
This means about 25% of delivered oxygen is extracted at rest. Mixed venous oxygen saturation is normally around 70–75%.
If oxygen delivery falls, tissues can compensate by extracting more oxygen. Mixed venous saturation falls.
Critical oxygen delivery
Normally, VO₂ is relatively independent of DO₂ because tissues adjust extraction.
As DO₂ falls:
- extraction increases,
- venous oxygen saturation falls,
- eventually extraction reaches a maximum,
- below a critical DO₂, VO₂ becomes supply-dependent,
- anaerobic metabolism and lactate production increase.
This is the physiological basis of shock resuscitation.
Clinical markers suggesting inadequate oxygen delivery or use:
- raised lactate,
- low mixed or central venous oxygen saturation in many forms of shock,
- metabolic acidosis,
- low urine output,
- altered mental state,
- cool peripheries in low-flow shock.
Caution:
In sepsis or cyanide poisoning, venous oxygen saturation may be normal or high despite tissue hypoxia because oxygen extraction or cellular use is impaired.
Oxygen demand
Oxygen demand is the oxygen required to meet metabolic needs.
In anaesthesia and ICU, oxygen demand rises with:
- pain,
- anxiety,
- agitation,
- fever,
- shivering,
- seizures,
- increased work of breathing,
- sepsis,
- burns,
- thyroid storm,
- malignant hyperthermia.
Oxygen demand can be reduced by:
- analgesia,
- sedation,
- control of fever,
- warming to prevent shivering,
- mechanical ventilation to reduce work of breathing,
- neuromuscular blockade in selected critical situations,
- treating seizures,
- controlling the underlying disease.
This is why oxygen management is not only about increasing supply; it is also about reducing unnecessary demand.
Quick check: delivery, consumption and extraction
What determines oxygen delivery?
Reveal answer
DO2 = cardiac output x CaO2 x 10. It can fail from low cardiac output, anaemia, low saturation, abnormal haemoglobin, or maldistributed flow.
What is oxygen extraction ratio?
Reveal answer
OER = VO2 / DO2. At rest it is about 25%, with mixed venous saturation around 70-75% in many normal adults.
What happens below critical oxygen delivery?
Reveal answer
Extraction can no longer compensate, VO2 becomes supply-dependent, anaerobic metabolism increases, and lactate may rise.
Preoxygenation and Oxygen Stores
Why preoxygenation works
The body has limited oxygen stores. During apnoea, oxygen continues to be consumed but no new oxygen enters the alveoli unless apnoeic oxygenation is provided.
The main store that can be increased quickly is the oxygen in the functional residual capacity.
Preoxygenation replaces alveolar nitrogen with oxygen, creating a larger oxygen reservoir in the lungs.
Nitrogen washout
Breathing 100% oxygen before induction washes nitrogen out of the alveoli and replaces it with oxygen.
Benefits:
- raises alveolar oxygen fraction,
- raises PAO₂,
- increases oxygen stored in FRC,
- delays desaturation during apnoea,
- increases safe apnoea time.
Common approaches:
- 3 minutes of tidal breathing with a tight seal,
- 8 vital capacity breaths in selected cooperative patients,
- CPAP or pressure support in obese, pregnant, or critically ill patients,
- head-up positioning to improve FRC,
- high-flow nasal oxygen in selected patients.
Who desaturates quickly?
Safe apnoea time is shorter when oxygen stores are low or oxygen consumption is high.
High-risk groups:
- children,
- obesity,
- pregnancy,
- critical illness,
- sepsis,
- fever,
- anaemia,
- low FRC,
- airway obstruction,
- poor preoxygenation seal,
- shunt physiology.
Important concept:
A patient with a low FRC and high metabolic rate can desaturate very rapidly after induction even after apparently adequate preoxygenation.
Apnoeic oxygenation
During apnoea, oxygen continues to move from alveoli into blood. If oxygen is supplied to the upper airway, it can move down into alveoli even without diaphragmatic movement, because oxygen uptake creates a pressure gradient.
Apnoeic oxygenation can delay desaturation but does not remove CO₂ effectively. Therefore PaCO₂ rises during apnoea.
Clinical point:
Apnoeic oxygenation supports oxygenation, not ventilation.
Quick check: preoxygenation
What does preoxygenation mainly increase?
Reveal answer
It replaces alveolar nitrogen with oxygen, increasing the oxygen reservoir in functional residual capacity and prolonging safe apnoea time.
Who desaturates quickly despite preoxygenation?
Reveal answer
Patients with low FRC, high oxygen consumption, shunt, poor mask seal, obesity, pregnancy, critical illness, sepsis, fever, anaemia, or airway obstruction.
What is the limitation of apnoeic oxygenation?
Reveal answer
It can support oxygenation during apnoea but does not remove CO2 effectively, so PaCO2 continues to rise.
Clinical Integration
Normal SpO₂ but tissue hypoxia: severe anaemia
A patient with Hb 6 g/dL and SpO₂ 100% can be critically oxygen limited.
CaO₂:
1.34 × 6 × 1.0 ≈ 8 mL/dL
This is less than half normal. Increasing FiO₂ helps only slightly because dissolved oxygen remains small at normal pressure.
Treatment is directed at:
- stopping bleeding,
- transfusion when appropriate,
- maintaining cardiac output,
- reducing oxygen demand,
- ensuring saturation remains high.
Low SpO₂ from hypoventilation
In opioid overdose or residual anaesthesia, PaCO₂ rises. The alveolar gas equation shows that PAO₂ falls as PaCO₂ rises.
Management:
- open airway,
- support ventilation,
- reverse opioid or neuromuscular blockade when appropriate,
- give oxygen,
- monitor CO₂.
Oxygen alone may hide desaturation while hypercapnia worsens.
Carbon monoxide poisoning
The patient may have:
- normal PaO₂,
- misleadingly normal pulse oximetry,
- low effective oxygen content,
- impaired unloading,
- tissue hypoxia.
Management:
- high-flow 100% oxygen,
- co-oximetry,
- consider hyperbaric oxygen in selected cases.
The problem is haemoglobin availability and affinity, not alveolar oxygen tension.
Cyanide poisoning
In cyanide poisoning:
- PaO₂ may be normal,
- SaO₂ may be normal,
- CaO₂ may be normal,
- venous oxygen saturation may be high,
- lactate is often high.
The problem is mitochondrial oxygen use. This is histotoxic hypoxia.
Shock
In shock, oxygen delivery may fail because cardiac output is low, haemoglobin is low, saturation is low, or flow is maldistributed.
Management aims to improve DO₂ and reduce VO₂:
- oxygen,
- airway and ventilation support,
- haemorrhage control,
- fluids or blood products where appropriate,
- vasopressors/inotropes when needed,
- source control in sepsis,
- analgesia, sedation, temperature control.
The key is to treat the limiting step, not only the saturation.
Sepsis
Sepsis may produce a confusing oxygen picture:
- cardiac output may be high,
- arterial oxygen content may be normal,
- venous oxygen saturation may be normal or high,
- lactate may still rise.
Reasons include:
- microcirculatory shunting,
- mitochondrial dysfunction,
- impaired extraction,
- increased glycolysis,
- beta-adrenergic stimulation,
- regional hypoperfusion.
Therefore, a normal ScvO₂ does not exclude cellular distress.
Transfusion and oxygen delivery
Transfusion increases oxygen-carrying capacity by increasing haemoglobin concentration.
However, transfusion is not only a number. Its effect depends on:
- ongoing bleeding,
- cardiac output,
- oxygen extraction,
- tissue perfusion,
- stored red cell function,
- risks of transfusion,
- patient comorbidity.
In oxygen physiology terms, transfusion increases CaO₂ and therefore DO₂, provided circulation delivers the red cells to tissues.
Quick check: clinical oxygen traps
Why is normal SpO2 dangerous as a single reassurance in severe anaemia?
Reveal answer
Saturation may be 100%, but CaO2 can be less than half normal if haemoglobin concentration is very low.
What is the limiting step in cyanide poisoning?
Reveal answer
Mitochondrial oxygen use fails. PaO2, SaO2, and CaO2 may be normal, while lactate rises and venous oxygen saturation may be high.
What does transfusion improve in oxygen physiology?
Reveal answer
It increases haemoglobin concentration, raising CaO2 and therefore DO2 if cardiac output and tissue perfusion deliver those red cells effectively.
High-Yield Equations and Values
Equations
How to use these equations: first identify whether the stem is asking about tension, content, delivery, extraction, or utilisation; then choose the matching equation.
| Equation | Meaning |
|---|---|
| PIO₂ = FiO₂ × (PB − PH₂O) | Humidified inspired oxygen tension |
| PAO₂ = PIO₂ − PaCO₂/R | Simplified alveolar gas equation |
| A–a gradient = PAO₂ − PaO₂ | Difference between alveolar and arterial oxygen tension |
| CaO₂ = (1.34 × Hb × SaO₂) + (0.003 × PaO₂) | Arterial oxygen content, PaO₂ in mmHg |
| CaO₂ = (1.34 × Hb × SaO₂) + (0.023 × PaO₂) | Arterial oxygen content, PaO₂ in kPa |
| DO₂ = CO × CaO₂ × 10 | Oxygen delivery |
| VO₂ = CO × (CaO₂ − CvO₂) × 10 | Oxygen consumption by Fick principle |
| OER = VO₂ / DO₂ | Oxygen extraction ratio |
Values to memorise
| Variable | Approximate value |
|---|---|
| Barometric pressure at sea level | 101.3 kPa / 760 mmHg |
| FiO₂ in air | 0.21 |
| Water vapour pressure at 37°C | 6.3 kPa / 47 mmHg |
| PIO₂ on air at sea level | ~19.9 kPa |
| PaCO₂ | ~5.3 kPa / 40 mmHg |
| Respiratory quotient | ~0.8 |
| PAO₂ on air at sea level | ~13.3 kPa |
| Normal PaO₂ on air | ~10–13 kPa |
| Normal SaO₂ | ~95–100% |
| Normal P50 | ~3.5 kPa / 26–27 mmHg |
| Hb oxygen capacity | ~1.34 mL O₂/g Hb |
| Normal CaO₂ | ~20 mL/dL |
| Normal DO₂ | ~1000 mL/min |
| Normal VO₂ | ~250 mL/min |
| Normal OER | ~25% |
| Normal mixed venous saturation | ~70–75% |
EDAIC Traps
- PaO₂ is dissolved oxygen tension, not total oxygen content.
- SpO₂ can be normal in severe anaemia.
- PaO₂ can be normal in carbon monoxide poisoning.
- Standard pulse oximetry may be misleading in CO poisoning and methaemoglobinaemia.
- Increasing FiO₂ after Hb is saturated adds little oxygen content at normal pressure.
- The HbO₂ curve is sigmoid because of cooperative binding.
- P50 increases with a right shift and decreases with a left shift.
- Right shift helps unloading but can impair loading if lung PO₂ is low.
- Left shift helps loading but can impair tissue unloading.
- Acidosis, CO₂, temperature, and 2,3-DPG shift the curve right.
- HbF, COHb, MetHb, hypothermia, alkalosis, and low 2,3-DPG shift the curve left.
- The alveolar gas equation links ventilation and oxygenation.
- Hypoventilation lowers PAO₂ by raising PaCO₂.
- A normal A–a gradient suggests low inspired oxygen or hypoventilation.
- A widened A–a gradient suggests V/Q mismatch, shunt, or diffusion limitation.
- Oxygen delivery depends mainly on cardiac output, haemoglobin, and saturation.
- Oxygen consumption may become supply-dependent in severe shock.
- High venous oxygen saturation does not always mean tissues are well oxygenated.
End-of-Module Summary
Oxygen transport is more than SpO₂. Oxygen must move from the atmosphere to mitochondria through a sequence of steps: inspired gas, humidification, alveolar ventilation, diffusion, arterial blood, haemoglobin, cardiac output, tissue extraction, and mitochondrial use.
Oxygen is carried mainly bound to haemoglobin. Dissolved oxygen determines PaO₂ but contributes little to total oxygen content at normal pressure. Therefore, a patient can have normal PaO₂ and SpO₂ but poor oxygen delivery if haemoglobin or cardiac output is low.
The arterial oxygen content equation is:
CaO₂ = (1.34 × Hb × SaO₂) + dissolved oxygen
Normal CaO₂ is about 20 mL/dL. Oxygen delivery is:
DO₂ = CO × CaO₂ × 10
Normal DO₂ is about 1000 mL/min, and normal VO₂ is about 250 mL/min.
The haemoglobin–oxygen dissociation curve is sigmoid because of cooperative binding. Its plateau protects saturation in the lungs, while the steep part supports unloading in tissues. P50 is the PO₂ at 50% saturation, normally about 3.5 kPa. A right shift increases P50 and promotes unloading. A left shift decreases P50 and increases affinity.
The oxygen cascade explains the fall in PO₂ from air to mitochondria. At sea level, dry atmospheric PO₂ is about 21.2 kPa, humidified inspired PO₂ about 19.9 kPa, alveolar PO₂ about 13.3 kPa, arterial PaO₂ about 10–13 kPa, and mitochondrial PO₂ much lower.
The alveolar gas equation shows how oxygenation and ventilation are linked:
PAO₂ = PIO₂ − PaCO₂/R
If PaCO₂ rises during hypoventilation, PAO₂ falls. The A–a gradient helps identify whether hypoxaemia is due to low inspired oxygen or hypoventilation, versus gas exchange problems such as V/Q mismatch, shunt, or diffusion limitation.
The key message is:
Do not treat the saturation alone. Treat the limiting step in the oxygen pathway.